A Gradation Curve is used to adjust the output colour of a job by applying a curve to the individual process colours. A Gradation Curve can be applied to a Media either as a Linearisation Curve, or as a Correction Curve.
A Linearisation Curve is the most common form of Gradation Curve used and is almost always applied to a Media as part of the calibration process. Linearisation Curves are created by printing and measuring linearisation charts using a supported Spectrophotometer and the Lineariser application.
A Correction Curve is applied to Media if a small amount of fine-tuning is required after normal calibration procedures. Gradation Curves used for colour correction can be created manually by a click-and-drag method, by entering individual input and output points, or by entering values into a Gradation Table.
To create a Gradation Curve:
- Open the Workbench application.
- Select Gradation Curve from the Workbench datatypes list.
- Create a new curve via File menu > New.
- Select the Media to which the Gradation Curve will be assigned from the chooser window.
- Enter a name for the curve in the highlighted “Untitled” field.
- Open the Gradation Curve toolbar (spanner icon).
Use any of the following methods to generate a DotGain Curve:
Click and Drag
- Select the specific Output colour channel to which the curve will apply from the available Channel Tabs.
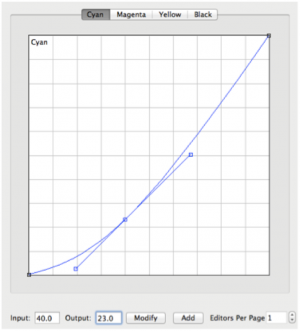
- New curves are displayed as a straight line (linear, with no effect on output colour). Left-click on any point of the curve and drag the curve to the desired shape.
- The curve produced is a bezier curve. A line with a handle at each end passes through the anchor point on the curve.
- Dragging each handle alters the curve at the anchor point. Increasing or decreasing the handle distance from the anchor point smoothes or sharpens the curve shape on either side of the anchor, which remains fixed.
- If required, left-click on another part of the curve to create a new anchor an drag the curve into the desired shape. Any number of additional anchors can be added.
- To remove an anchor point, select the point and press the Delete key.
- Repeat steps 1-5 if required to make Gradation Curves for the remaining output colour channels.
- Save the completed Gradation Curve via File menu > Save.
- Assign the curve to the Correction LUT field in the Colour Correction panel of the Media.

Entering Individual Input and Output Values
Anchor points used to create a DotGain Curve can be entered precisely in the Input (source file ink coverage) and Output fields. Output is the adjusted print coverage value to be used to reproduce the required source coverage taking dot gain into account.
- Enter values into the Input and Output fields and press Add to create the anchor point.
- Existing anchor points can be changed by first selecting the point on the curve, altering the Input and Output values, then pressing Modify.

Gradation Table
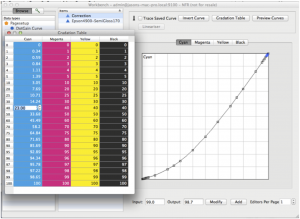
A Correction Curve can be created by entering values directly into a Gradation Table.
- After creating and naming a new Gradation Curve, press the Gradation Table button in the toolbar. A popup window containing the Gradation Table will open.
- Double-click on each of the coloured fields for each output colour channel and enter the required coverage values for each coverage % listed in gray. Anchor points will be added, creating the Gradation Curve as each value is entered in the table.
- Close the Gradation Table window when done.
- Save the completed Gradation Curve via File menu > Save.
- Assign the curve to the Correction LUT in the Colour Correction panel of the Media.

